Aarhus University Seal

Explanation of live stream image

Most people have not heard of a hydrophone before, so to briefly explain the principle, here is a brief description of what you will find on this live streaming channel.

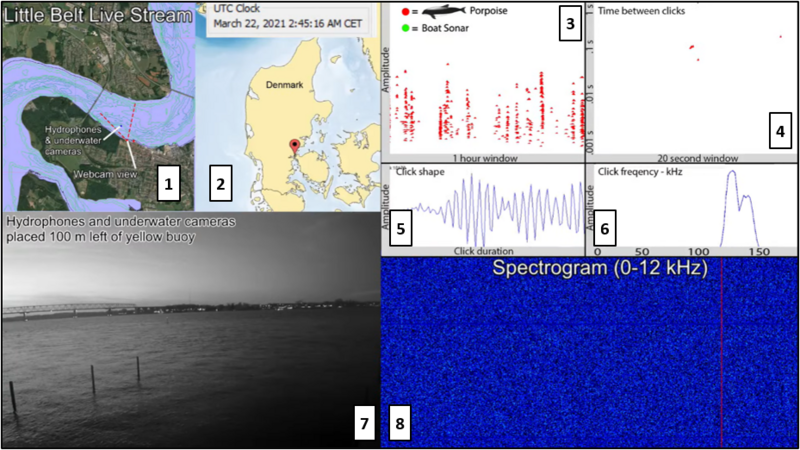
A hydrophone resembles a microphone, only it is designed to record sound under water. By placing a hydrophone in the Little Belt, we get direct live access to life under the surface and therefore also a better insight into the significance of sound, as well as a greater understanding of the noise impact that we humans exert on the ability of animals to navigate, locate food and detect danger. Marine mammals in particular make extensive use of sound to locate food and communicate and that is one of the reasons why we have a strong focus on the porpoise.

  1. Map of the Little Belt at the town of Middelfart coupled to AIS (automatic identification system), allowing you to see when boats and ships with an AIS transmitter on board are sailing through the belt. Not all ships use AIS registration, so occasionally ships will pass without appearing on the map.
  2. Map showing the location of the listening station on a map of Denmark.
  3. The graph shows the sounds recorded within the last hour. The red symbols show every time a porpoise has emitted a sound within a distance of approx. 300 m. The green symbols indicate that a boat has passed by with its echo sounder switched on.
  4. The graph displays the time between two porpoise clicking sounds, which tells us whether the porpoise is searching for food (0.1 seconds between clicks) or eating it (0.01-0.001 seconds between clicks).
  5. Graph of the most recently recorded soundwave of the clicking sounds that porpoises emit (the graph above shows a typical porpoise click).
  6. Graph of the frequencies that the most recent porpoise click includes. Porpoise clicks typically have a centre frequency of 130 kHz, i.e. far beyond what a human can hear.
  7. This webcam image shows a live video from the study area. The hydrophone is placed at a depth of 12 m a little to the left of the middle and between the two yellow buoys indicated by blue dots on the map (1). The location of the webcam and the visual field that you can see are also displayed on the map (1). When a ship crosses the red line on the map, it can be seen on the webcam.
  8. This is a spectrogram, and it shows 0-12 kHz sounds on the x axis and time on the y axis. The sound is displayed in colours starting with black/dark blue when there is no sound. With increasing volume, the dark colour becomes lighter and then green, yellow and orange. When the colour is red, the sound is very high.